![BCG Logo - Color - 2-1.png]](https://knowledge.bestcompaniesgroup.com/hs-fs/hubfs/BCG%20Logo%20-%20Color%20-%202-1.png?height=50&name=BCG%20Logo%20-%20Color%20-%202-1.png)
If interested in learning more or pricing, please contact surveyenhancements@bestcompaniesgroup.com
Graphics -

See what moves the needle on employee engagement
How good are your survey scores? Which ones actually matter? And what should you work on first?
To answer that last question, it's natural to start with your lowest score. A weak score on a less important topic can cost a great deal to fix and have very little impact, whereas a high score isn't automatically a strength: if every organization scores well on that topic, yours is only keeping pace.
BCG Leverage Analysis helps you focus on the topics most likely to improve engagement, so you can invest your time and resources where they'll have the greatest impact. It’s a new approach to key driver analysis that works at the topic level, so the answer arrives in terms you can act on.
How it works:
- We group individual survey items into 12 actionable workplace topics
- We measure how strongly each topic relates to engagement in your own data (Leverage)
- We compare your topic ratings to the BCG National Baseline, so you know where you stand (Relative Performance)
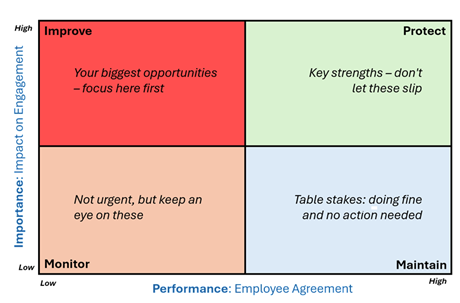
- We put the two together and tell you what to do with each: improve, protect, monitor, or maintain
The result is a simple roadmap showing where to focus, which strengths to protect, and which areas require less immediate attention.
Product Options and Specifications:
- Base product: Company drivers (drivers unique to the company)
- Companies must have at least 50 responses to run a company-specific Leverage analysis
- Sub-Topic Option: Instead of using Engagement as the dependent variable, the analysis can be run using the sub-category Topics: Advocacy & Pride, Commitment, and Employee Satisfaction
- This is ideal for companies that may have a weaker score in one of these areas, relative to the other topics within Engagement
- Benchmark Option: Instead of running drivers at the company level, we can run drivers at a benchmark level.
- This is an ideal option for companies that have fewer than 50 responses, providing them with drivers that are relevant to their type of company
- Benchmark options could be, for example, run based on data from:
- The Program that the company is participating in
- Program data filtered for company size (if at least 50 responses for that size company)
- Custom benchmark data
FAQ
What is driver/leverage analysis?
- Driver analysis helps identify what has the biggest impact on employee engagement. Rather than looking only at survey scores, it shows which topics are most strongly connected to engagement, intent to stay, or another key outcome
- It helps prioritize where to focus improvement efforts. Not every survey item has the same influence. Driver analysis highlights the areas that are most likely to improve overall results if they get better
- It turns survey data into action. Instead of asking, "What scored lowest?" driver analysis helps answer, "What should we work on first to make the biggest difference?"
What does “Leverage” mean?
- We use the term Leverage to distinguish this approach from traditional Key Driver Analysis (KDA). It reflects the idea that certain aspects of the employee experience act as "levers" that can have a bigger impact on engagement when improved.
- A Topic's Leverage score indicates how strongly it helps explain differences in engagement across employees. Topics with higher Leverage have a stronger relationship to engagement and are therefore more likely to influence overall results.
- A lower Leverage score does not mean a Topic is unimportant. Instead, it means the Topic does less to differentiate the employee experience. For example, compensation is important to nearly everyone, but if perceptions of pay are relatively similar across employees or organizations, it may contribute less to explaining why engagement varies than other Topics where experiences differ more substantially.
What is being “driven?”
- Drivers are derived in relation to a specific outcome (dependent variable)
- The default dependent variable for BCG Leverage Analysis is Employee Engagement (the full, traditional BCG Engagement category)
- We also have broken engagement down into three topics: Advocacy & Pride, Commitment, and Employee Satisfaction
- We have the ability to run drivers of those Topics, in addition/instead of Engagement
What’s the difference between the two methods, in terms of statistical analysis? Why is it better?
- The original KDA used a linear regression. The new product uses Johnson’s Relative Weights (JRW) analysis instead.
- JRW is a better method to use when attribute ratings are highly correlated (similar), which is true for the BCG survey. JRW is also better because:
- It gives a fairer picture of what matters most. Survey topics like leadership, communication, and recognition are often closely related. Traditional regression forces those topics to compete with each other, while Relative Weights shares credit more fairly across related drivers
- The results are more stable and trustworthy. With regression, small changes in the data can cause big changes in driver rankings. Relative Weights tends to produce more consistent rankings, making it easier to identify the real priorities
- It's easier to explain to leaders. Instead of technical statistics, Relative Weights answers a simple business question: "What percentage of engagement is influenced by each area?"
How were the attributes put into Topics?
- The topics are based on BCG’s traditional survey categories, so that all topics roll up to those categories. They just provide more nuance than some of the broader categories
- In this analysis, the Leadership and Work Environment categories remain intact – there are no sub-categories
- The thematic groupings were refined through expert review to ensure attributes within each topic represented similar workplace themes
Why does the “Topic” for Pay & Benefits only include the two general statements/attributes and not the individual benefit attributes?
- Individual benefit items often have lower response rates because they are not relevant to all employees, which can make the analysis less stable and reliable
- Our testing found that including individual benefit items tends to dilute the overall impact of Pay & Benefits, resulting in a less representative measure of the Pay & Benefits experience
- If a company has a low score for the Pay & Benefits category, best practice is to review the raw scores for the individual benefits to narrow down to the ones that are most problematic
Why are Engagement attributes used as the outcome/dependent variable, not as drivers?
- Engagement attributes are generally considered outcomes of the employee experience, while other survey topics (such as leadership, communication, recognition, and benefits) are the factors that influence those outcomes
- Effective driver analysis focuses on areas that leaders can directly improve. For example, an organization can change its PTO policy, improve manager communication, or strengthen career development opportunities. In contrast, outcomes such as "I would recommend this company as a great place to work" are the results of those efforts, not actions that can be directly managed
- By using Engagement as the outcome, driver analysis helps identify the specific workplace experiences that are most likely to increase engagement and related behaviors, such as advocacy, retention, and discretionary effort
What does “Relative Performance” mean and why does the analysis use it?
- Relative performance means looking at a company’s Topic score compared to a benchmark. By default, the analysis compares the company’s score to scores from the BCG National Baseline
- Scores are expressed as company score minus the benchmark score. (e.g. +10, -10)
- This is better than using the ‘raw’ data because it accounts for generalized norms
- Relative performance helps identify true strengths and weaknesses. Raw scores can be misleading because some survey items naturally score higher or lower than others. Comparing a score to its benchmark shows whether you're actually overperforming or underperforming on that topic relative to expectations.
- It focuses the analysis on the biggest opportunities. A driver with a decent raw score may still be a priority if it's performing well below benchmark, while a lower-scoring item may not need attention if it's already outperforming peers. Relative performance helps direct action to where improvement is most likely to have an impact
What are the driver “quadrants” and what do they mean?
- We graph the leverage weights vs relative performance to determine what kind of priority is attached to each topic
- BCG Leverage Analysis quadrants are defined as follows:
- Improve (High impact, lower relative score. Prioritize action.)
- Protect (High impact, higher relative score. Preserve as a strength.)
- Monitor (Lower impact, lower relative score. Track over time)
- Maintain (Lower impact, higher relative score. Continue current approach)
Topic Definitions
- Leadership
- I understand the long-term strategy of this organization
- I have confidence in the leadership of this organization
- The leaders of this organization care about their employees’ well being
- Senior leaders live the core values of the organization
- The leaders of this organization are open to input from employees
- Communications
- This organization's corporate communications are frequent enough
- This organization's corporate communications are detailed enough
- This organization effectively communicates its progress towards meeting departmental goals
- I have a good understanding of how this organization is doing financially
- Changes that may affect me are communicated to me prior to implementation
- Workplace Culture
- I can trust what this organization tells me
- This organization treats me like a person, not a number
- This organization gives me enough recognition for work that is well done
- Staffing levels are adequate to provide quality products/services
- Quality is a top priority with this organization
- Safety is a top priority with this organization
- I believe there is a spirit of cooperation within this organization
- I like the people I work with at this organization
- At this organization, employees have fun at work
- Inclusion & Voice
- I feel I can express my honest opinions without fear of negative consequences
- My employer enables a culture of diversity
- This organization makes a strong effort to minimize discrimination
- Role Fulfillment
- I like the type of work that I do
- I am able to maintain a reasonable balance between work and my personal life
- My job makes good use of my skills and abilities
- I have a clear understanding of my job role
- I understand the importance of my role to the success of the organization
- I believe my job is secure
- Most days, I feel I have made progress at work
- Organizational Support
- I am given enough authority to make decisions I need to make
- Deadlines at this organization are realistic
- I feel I am valued in this organization
- I feel part of a team working toward a shared goal
- Work Environment
- My physical working conditions are good
- My general work area is adequately heated/cooled
- There is adequate noise control to allow me to focus on my work
- My workspace has adequate privacy for me to do my job
- I feel physically safe in my work environment
- Supervisor Communication
- My supervisor acknowledges when I do my work well
- My supervisor tells me when my work needs improvement
- My supervisor is open to hearing my opinion or feedback
- I feel I can trust what my supervisor tells me
- Supervisor Support
- My supervisor treats me fairly
- My supervisor treats me with respect
- My supervisor handles my work-related issues satisfactorily
- My supervisor handles my personal issues satisfactorily
- My supervisor wants me to develop to my fullest potential
- Growth & Development
- This organization provided as much initial training as I needed
- This organization provides as much ongoing training as I need
- This organization helps me pursue a career path that aligns with my skills and interests
- This organization encourages me to develop professionally and/or acquire new skills
- If I do good work, I will be rewarded
- Technology & Resources
- This organization provides the technology, equipment and resources I need to do my job well
- The computer or other hardware I use to do my job is dependable
- The software and program applications I use to do my job are adequate
- Technology issues are resolved in a timely manner
- Technology issues affecting my work are communicated to me in a timely manner
- Overall Pay & Benefits
- My pay is fair for the work I perform
- Overall, I'm satisfied with this organization's benefits package
Note: “Benefits Package” is not included in driver analyses
- I'm satisfied with the amount of vacation (or Paid Time Off)
- I'm satisfied with the sick leave policy
- I'm satisfied with the amount of healthcare paid for
- I'm satisfied with the dental benefits
- I'm satisfied with the vision care benefits
- I'm satisfied with the retirement plan benefits
- I'm satisfied with the life insurance benefits
- I'm satisfied with the disability benefits
- I'm satisfied with the tuition reimbursement benefits
Unless otherwise specified, the entire Engagement battery is used as the dependent variable. For other purposes, it can be broken into three sub-categories:
- Advocacy & Pride
- I would recommend this organization's products/services to a friend
- I would recommend working here to a friend
- I am proud to work for this organization
- Commitment
- I am willing to give extra effort to help this organization succeed
- I plan to continue my career with this organization for at least two more years
- Employee Satisfaction
- Overall, I am very satisfied with my employer
- Most days, I look forward to going to work
- My job provides me with a sense of meaning and purpose
- I feel this organization has created an environment where I can do my best work
Methodology:
Company-specific Leverage Analysis includes the following:
- Johnson’s Relative Weights analysis is used to derive the company’s unique relative leverage scores for each of BCG’s thematic driver categories.
- National Baseline benchmark scores (% Agreement) are subtracted from the company’s driver scores to derive relative performance
- Leverage and Relative Performance are graphed into a four quadrant scatterplot. The dividing lines for the quadrants are:
- Average relative Leverage score
- Median relative performance score


If interested in learning more or pricing, please contact surveyenhancements@bestcompaniesgroup.com